26.2. Sample Code-Runner Section#
26.2.1. 显示执行内容#
此处使用 Python 构建 .ipynb 代码块,显示内容为 Cache 缓存。
在 _config.yml 中可以添加 allow_errors 标签,允许在单元级别出现错误。
print("A Python Cell")
for i in range(50):
    print(i)
A Python Cell
0
1
2
3
4
5
6
7
8
9
10
11
12
13
14
15
16
17
18
19
20
21
22
23
24
25
26
27
28
29
30
31
32
33
34
35
36
37
38
39
40
41
42
43
44
45
46
47
48
49
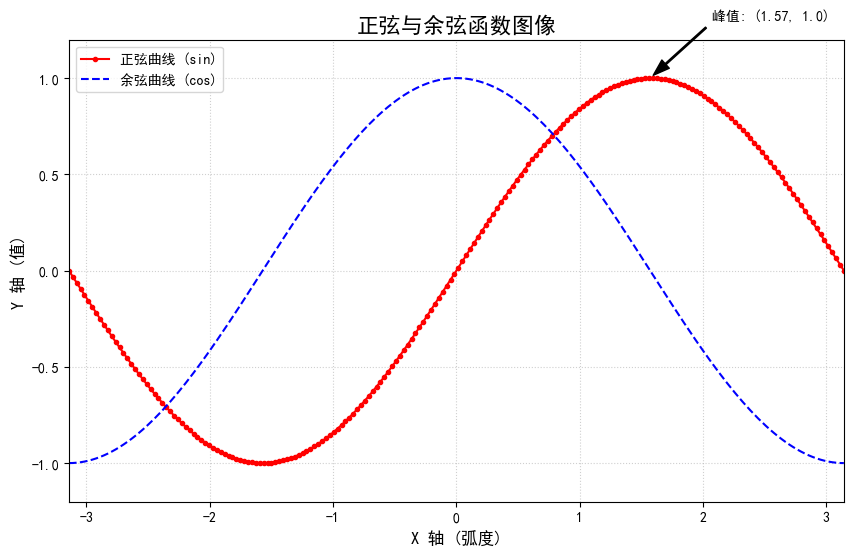
26.2.2. 使用 Matplotlib 库绘制图表#
使用 mystnb 中 image 的 width 来调整图片的大小。
import matplotlib.pyplot as plt
import io
import numpy as np
from IPython.display import Image # 明确引入 Image

plt.rcParams['font.sans-serif'] = ['SimHei']
plt.rcParams['axes.unicode_minus'] = False

x = np.linspace(-np.pi, np.pi, 200)
y_sin = np.sin(x)
y_cos = np.cos(x)

fig, ax = plt.subplots(figsize=(10, 6), dpi=100)
ax.plot(x, y_sin, color='red', linestyle='-', marker='o', markersize=3, label='正弦曲线 (sin)')
ax.plot(x, y_cos, color='blue', linestyle='--', label='余弦曲线 (cos)')
ax.set_title('正弦与余弦函数图像', fontsize=16)
ax.set_xlabel('X 轴 (弧度)', fontsize=12)
ax.set_ylabel('Y 轴 (值)', fontsize=12)
ax.set_xlim(-np.pi, np.pi)
ax.set_ylim(-1.2, 1.2)
ax.grid(True, linestyle=':', alpha=0.6)
ax.legend(loc='upper left')

peak_x = np.pi / 2
peak_y = np.sin(peak_x)
ax.annotate(
    f'峰值: ({peak_x:.2f}, {peak_y})',  # 注解文本
    xy=(peak_x, peak_y),              # 要标注的点
    xytext=(peak_x + 0.5, peak_y + 0.3), # 文本放置的位置
    arrowprops=dict(facecolor='black', shrink=0.05, width=1, headwidth=8), # 箭头样式
    fontsize=10
)
Text(2.0707963267948966, 1.3, '峰值: (1.57, 1.0)')